🔗 Elliott & Phi in Perfect Harmony - Unlock the Code!
🎯
Master the Art of Trading with Precision
📈 At Chart Traders, we go beyond conventional technical analysis. Our method integrates the Phi Formula and Elliott Wave Theory, enabling you to anticipate market movements with precision and trade with confidence.
👉Our approach is built on the combined power of the Phi Formula and Elliott Wave Theory, designed to help you predict market movements and trade with confidence.
🚀 Our Core Trading Methodology

We believe market prices are not random. They follow structured, mathematical patterns. We combine:
📌The Golden Ratio (Phi, ϕ) –Merging timeless wisdom with modern Phi-based systems to pinpoint high-probability reversal points and guide your trading success.
📌Elliott Wave Theory – A proven method that enables us to forecast market cycles and predict price movements in advance.
📌Advanced Price Action Analysis – To validate trends, identify reversals, and pinpoint optimal entry points.
💡Result? A rule-based, systematic strategy that empowers you to stay ahead of market shifts with precision.
🎯
Predicting Market Movements with Confidence
We provide clear trade scenarios to anticipate price direction: ✅ Solid Green Arrows: Expected upward movement (long trades).
❌ Solid Red Arrows: Expected downward movement (short trades).
These projections outline trade opportunities while maintaining flexibility in timing.
Alternative Scenarios: Adapting to Market Shifts
To enhance precision, we integrate contingency plans:
- Dashed Green Arrows: Potential alternate upward movements.
- Dashed Red Arrows: Possible downward shifts.
- Probability Ratings: Each scenario is assigned a likelihood score to help you assess market risks effectively.
Strategic Support & Resistance Levels
Support & resistance levels play a vital role in trade timing & risk management:
- Support (Blue Lines & Red Downward Arrows): Bounce points for price surges, ideal for stop-loss placements.
- Resistance (Red Lines & Green Upward Arrows): High-probability reversal zones, guiding potential breakout strategies.
Precision Trading with Candle Patterns
We refine trade execution with high-reliability candle formations:
- Engulfing Patterns: Indicating strong trend shifts.
- Head & Shoulders (SHS): Powerful pattern for reversals and breakout trades.
By combining these elements with Phi-based Fibonacci projections, we create an edge in market timing and execution.
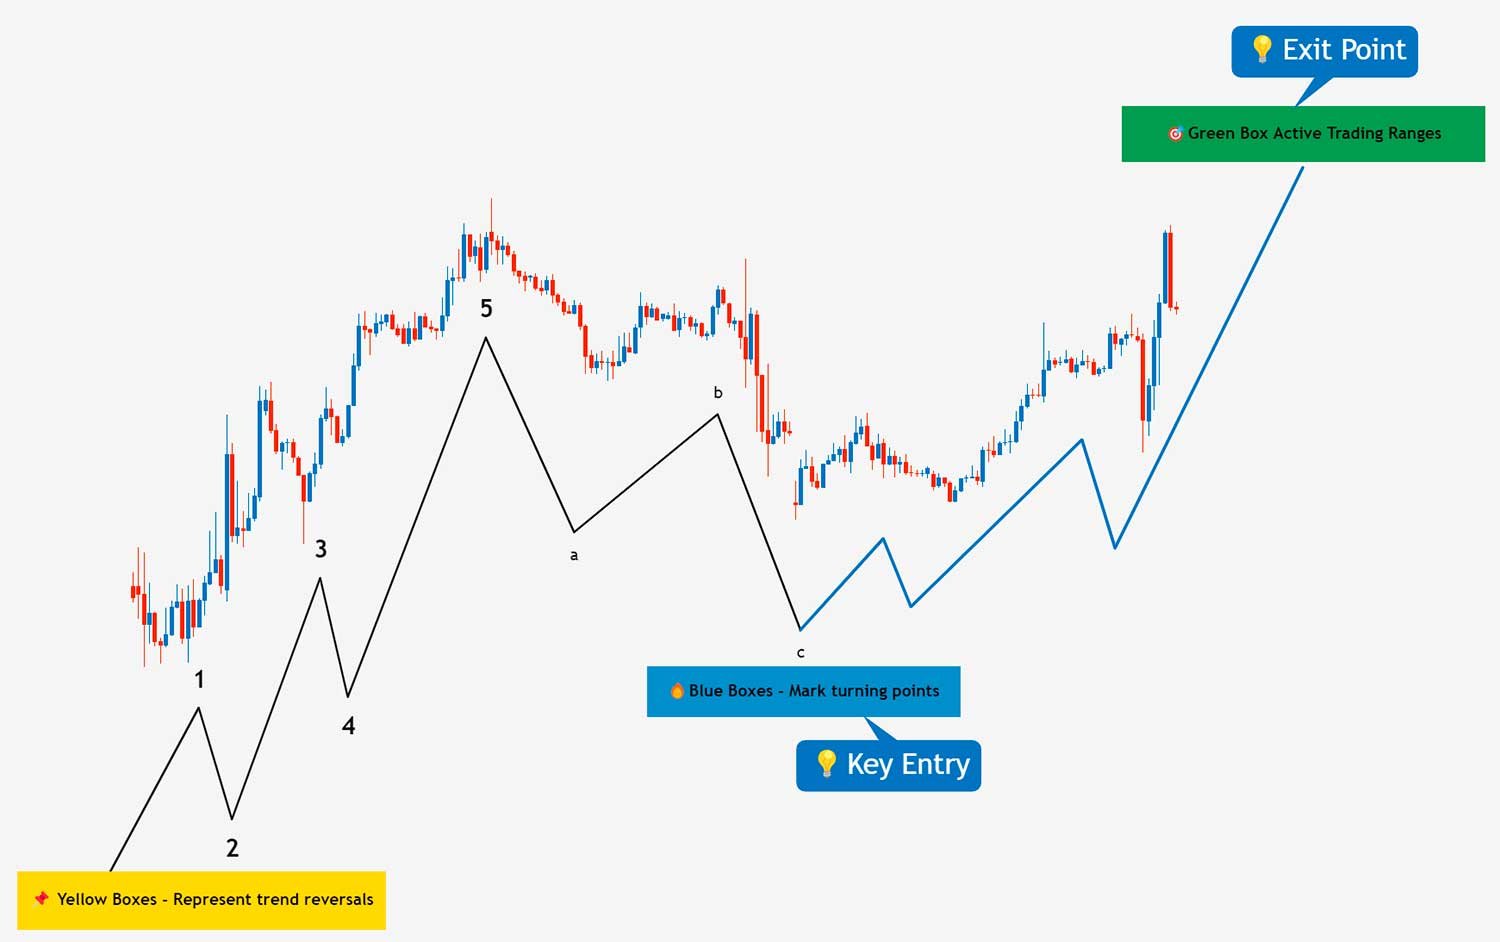
Decoding Our Charts: A Trader’s Edge
Our charts are built to provide actionable insights, allowing you to navigate the markets with clarity and control.
1️⃣ High-Probability Entry & Exit Points
We highlight precise trade zones, helping you capitalize on market opportunities.
2️⃣ Elliott Wave Market Phases
Track price movements with confidence by identifying key impulse and corrective waves.
3️⃣ Fibonacci-Based Price Targets
Using Fibonacci extensions and retracements aligned with the Phi Formula, we calculate strategic price levels for informed trading decisions.
4️⃣ Real-Time Market Updates
Stay ahead with continuous market adjustments, keeping you informed of emerging trends and opportunities.
🚀
Trade Smarter, Trade with Confidence
At Chart Traders, our precision-driven methodology helps you trade with clarity, control, and confidence. By identifying high-probability target zones, tracking key support & resistance levels, and integrating Elliott Wave analysis, we empower you to navigate the markets effectively.
🔍 Ready to gain an edge?
✔ Join Chart Traders Basic for free insights.
✔ Upgrade to Chart Traders Plus for exclusive trade setups & premium analysis.